HST/STIS Target Acquisition Simulator
Utility to simulate HST/STIS target acquisitions with various “optional parameters” available in the Astronomer’s Proposal Tool (APT) on a user-supplied FITS image.
Warning
To use input data not derived from STIS acquisition images, some pre-processing is required. See Limitations for more details.
Please note that AURA/STScI is not responsible for any damages resulting from the use of this software.
![Example output on o6fm02q7q_raw.fits[1]](_images/example_o6fm02q7q.png)
bash$  stistarg --ext 1 --diffuse 7 --display o6fm02q7q_raw.fits
--------------------------------------------------------------------------------
STIS Target Acquisition Simulator
stistarg.pyc v2.4
Python v3.7.4
Run time:  2017-01-20 11:39:04

Input File:      o6fm02q7q_raw.fits[1]
Input Options:   diffuse source, checkbox size = 7
Image Subarray:  (130, 134)

Brightest checkbox flux:  16653
Flux center:              axis1 = 66.0 ; axis2 = 73.0  [Grey X]
Geometric center:         axis1 = 66.0 ; axis2 = 73.0  [Orange X]

(All coordinates are zero-indexed.)
--------------------------------------------------------------------------------
Installation
The stistarg package may be installed in a conda environment:
conda install -c sean-lockwood stistarg
Alternatively, you may download and manually install stistarg via:
python setup.py install
Note that this package requires astropy and matplotlib.
Command Line Interface
For more information, type stistarg --help
usage: stistarg [-h] [--ext EXT] [--point | --diffuse CHECKBOXSIZE] [--display]
                FILENAME

Simulate HST/STIS onboard target acquisition algorithm on user data.

positional argument:
  FILENAME              Input FITS file

optional arguments:
  -h, --help            show this help message and exit
  --ext EXT             Input FITS extension [default=0]
  --point               Point-source algorithm [default]
  --diffuse CHECKBOXSIZE
                        Diffuse-source algorithm. Specify checkboxsize
                        [odd integer 3-101]
  --display, -d         Display results with matplotlib.pyplot

Version 2.4; Written by Berry & Lockwood
Python API
- stistarg.stistarg(filename, ext=0, source='point', checkboxsize=3, display=False)
HST/STIS Target Acquisition Simulator
- Args
filename (str): FITS file to simulate
- Kwargs
ext (int): FITS extension of filename to use
source (str): “point” or “diffuse”
checkboxsize (int): size of square checkbox [pixels] to use for diffuse source geometric algorithm
display (bool): displays results and pauses execution
- Returns
dict of:
- checkboxFlux: maxFlux (int)
total flux within the brightest checkbox
- fluxCentroid: (x (float), y (float))
centroid calculated with flux-centroid algorithm
- geometricCentroid: (x (float), y (float))
centroid calculated with geometric-centroid algorithm
checkbox_x: lower-left corner X-coordinate of checkbox
checkbox_y: lower-left corner Y-coordinate of checkbox
- Note
stistarg currently supports only the STIS detector format and scale. The capability to use non-STIS data will be added in a future release.
Auxiliary Functions
- stistarg.findcheckbox(inarray, checkboxsize)
Finds the brightest checkbox within the input image sub-array, and returns its location and flux.
- Args
inarray (np.ndarray): input array
checkboxsize (int): size of the (square) checkbox
- Returns
maxFluxRow (float): x location of brightest checkbox
maxFluxCol (float): y location of brightest checkbox
maxFlux (int): maximum flux value
- stistarg.calculate_flux_centroid(inarray, x, y, checkboxsize, centroidmode='flux')
Calculates a flux-weighted or geometric centroid within a given checkbox of the supplied array.
- Args
inarray (np.ndarray): input array
maxfluxrow (int): x location of brightest checkbox
maxfluxcol (int): y location of brightest checkbox
checkboxsize (int): size of the (square) checkbox
- Kwargs
centroidmode (str): “flux” or “geometric” centroid algorithm
- Returns
rowcentroid (float): x location of centroid using specified centroid algorithm
colcentroid (float): y location of centroid using specified centroid algorithm
- Warning – Not Implemented
Before computing the flux-weighted centroid, this function checks the total flux within the checkbox. If it does not exceed a scaled box-flux threshold, there is not enough flux in the checkbox to perform a meaningful flux-weighted centroid, and the geometric center of the checkbox is computed instead.
- stistarg.display_results(arr, flux_x, flux_y, chkx, chky, checkboxsize, geo_x=None, geo_y=None, filename=None, ext=None)
Displays the input array annotated with the brightest checkbox and flux/geometric positions.
- Args
arr (np.ndarray): input array
flux_x (float): x location using flux-centroid algorithm
flux_y (float): y location using flux-centroid algorithm
chkx (int): x location of the checkbox
chky (int): y location of the checkbox
- Kwargs
geo_x (float): x location using flux-centroid algorithm
geo_y (float): y location using flux-centroid algorithm
filename (str): filename to be used in image title
ext (int): extension number to be used in image title
Example Usage: checkboxsize Stability
import stistarg

import numpy as np
from astropy.io import fits
import matplotlib
%matplotlib inline
from matplotlib import pyplot as plt

# Some plotting parameters:
matplotlib.rcParams['image.origin'] = 'lower'
matplotlib.rcParams['image.cmap'] = 'inferno'
matplotlib.rcParams['image.aspect'] = 'equal'
matplotlib.rcParams['image.interpolation'] = 'none'
matplotlib.rcParams['figure.figsize'] = [10, 8]

stistarg.__version__
'2.4'
filename = 'o6fm02q7q_raw.fits'
# Define checkbox sizes to run the simulator on:
checkbox_sizes = np.arange(3, 27+1, 2)
# Define empty arrays to populate with results from stistarg:
x = np.zeros_like(checkbox_sizes, dtype=np.float)
y = np.zeros_like(checkbox_sizes, dtype=np.float)
# Run stistarg for different checkbox sizes:
for i, checkbox_size in enumerate(checkbox_sizes):
simulation = stistarg.stistarg(filename, ext=1, source='diffuse', checkboxsize=checkbox_size)
x[i], y[i] = simulation['fluxCentroid']
fig, ax = plt.subplots(1, 1)
ax.imshow(fits.getdata(filename, ext=1))
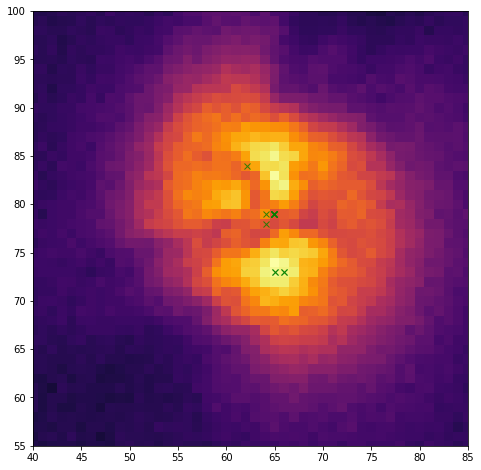
ax.plot(x, y, 'gx', alpha=0.8)
ax.set_xlim(40, 85)
ax.set_ylim(55, 100)
Plotting the various flux centroid positions found by the simulator:
And now plot these vs checkboxsize:
fig, axes = plt.subplots(2, 1, sharex=True)
fig.set_size_inches(10, 7)

axes[0].plot(checkbox_sizes, x, '.-')
axes[1].plot(checkbox_sizes, y, '.-')

# Some plotting parameters:
axes[0].set_ylim(61, 75)
axes[1].set_ylim(71, 85)
axes[0].set_ylabel('X [pix]')
axes[1].set_ylabel('Y [pix]')
axes[1].set_xlabel('Checkbox Size [pix]')
fig.suptitle(filename.rsplit('_',1)[0].upper())
[ax.grid(True, alpha=0.2) for ax in axes];
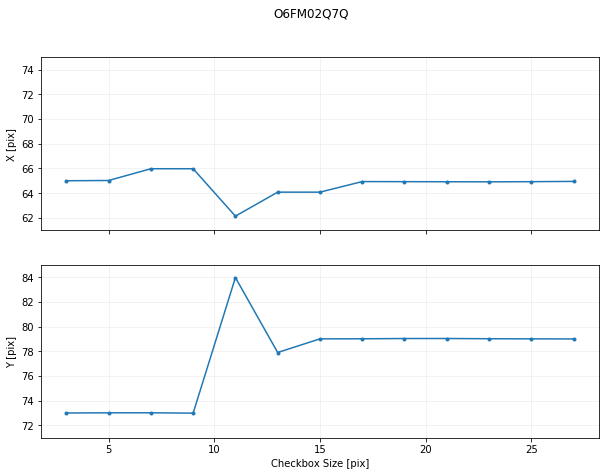
stistarg appears to have found two regimes of stable solutions: a local knot when the checkbox size is 3-9 pix, and a global solution when ≥15 pix. Two of these are plotted below using the simulator to confirm.
Users are advised to avoid checkbox sizes bordering transitions, as slight variations in the detected scene count rates could give unpredictable results. Varying the parameter allows users to determine stable regimes.
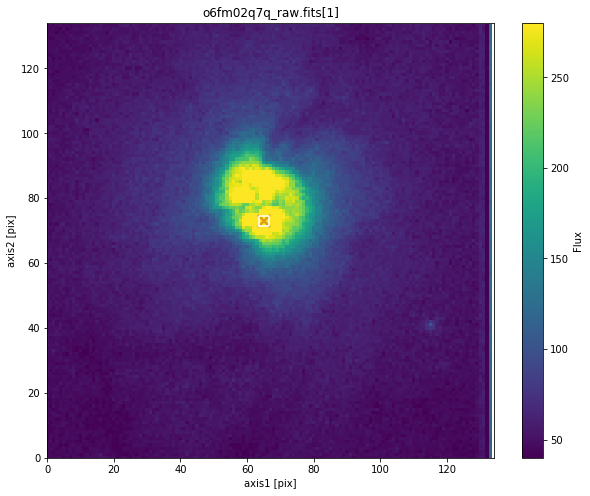
stistarg.stistarg(filename, ext=1, source='diffuse', checkboxsize=3, display=True)
The smaller checkboxsize found a small bright feature within the galaxy:
--------------------------------------------------------------------------------
STIS Target Acquisition Simulator
stistarg.py v2.4
Python v3.6.3
Run time:  2018-07-27 12:53:29

Input File:      o6fm02q7q_raw.fits[1]
Input Options:   diffuse source, checkbox size = 3
Image Subarray:  (129, 134)

Brightest checkbox flux:  3420
Flux center:              axis1 = 65.0 ; axis2 = 73.0  [Grey X]
Geometric center:         axis1 = 65.0 ; axis2 = 73.0  [Orange X]

(All coordinates are zero-indexed.)
--------------------------------------------------------------------------------
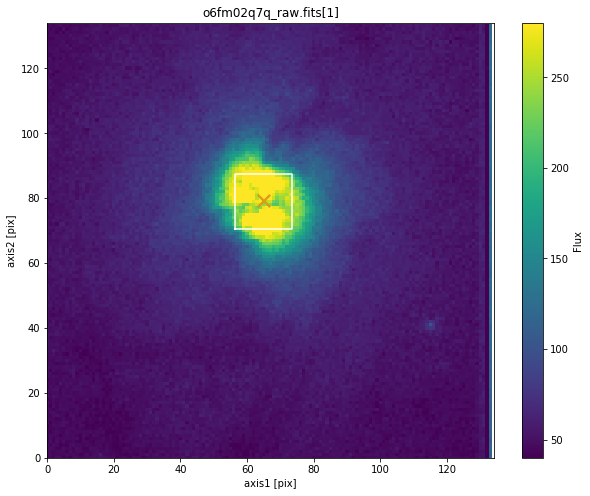
The larger checkboxsize found the center of the galaxy:
stistarg.stistarg(filename, ext=1, source='diffuse', checkboxsize=17, display=True)
--------------------------------------------------------------------------------
STIS Target Acquisition Simulator
stistarg.py v2.4
Python v3.6.3
Run time:  2018-07-27 12:53:31

Input File:      o6fm02q7q_raw.fits[1]
Input Options:   diffuse source, checkbox size = 17
Image Subarray:  (129, 134)

Brightest checkbox flux:  83938
Flux center:              axis1 = 64.9 ; axis2 = 79.0  [Grey X]
Geometric center:         axis1 = 65.0 ; axis2 = 79.0  [Orange X]

(All coordinates are zero-indexed.)
--------------------------------------------------------------------------------
Limitations
This release currently supports only the STIS detector format and scale. The capability to use non–STIS data will be added in a future release. Users wishing to use data from other sources must trim and rescale their input data accordingly. The STIS CCD plate scale is 0.050725 arcsec/pix.
Furthermore, stistarg assumes the use of STIS acquisition image data and trims out the last five columns from the input array before performing calculations (these are normally hot). To skip this behavior, users should pad their data accordingly.
Support
For support, please contact the STScI HST help desk.

